Introduction
Common-sense ideas about where a city’s neighborhoods begin and end rarely coincide entirely with the discrete and unyielding borders plotted on maps or entered into digital data structures. While paper maps depicting urban neighborhoods changed only incrementally and had a limited range of uses (navigation, tourism, government services), today neighborhood boundaries and names propagate quickly through dynamically updated digital services used daily by millions of people, with unanticipated effects. Although land managers, city planners, architects, and academics have been using rudimentary Geographic Information Systems (GIS) to represent urban space in software since the 1960s, and late 1990s services like Mapquest and Citysearch brought information about urban amenities online, it was the rapid adoption of mobile Internet access after the iPhone’s launch in 2007 that led to today’s proliferation of location-based services (LBS) and other ‘geoweb’ applications. 1 Walking around the city with a GPS-enabled smartphone, city dwellers and visitors can access a dazzling variety of geographically specified data, from walking directions on Google Maps, restaurant reviews on Yelp, and geotagged photos on Flickr, to pothole reports on SeeClickFix and prospective suitors on Grindr and Tinder. These and countless other layers and types of data together constitute what Lev Manovich calls ‘augmented space,’ an overlay of dynamically changing information that extends over all of physical space, albeit unevenly. 2 In daily use, these digital services transcend the category of merely utilitarian software to become what Rob Kitchin et al. call ‘spatial media,’ since they do not just ‘represent space but are integral to the production of space,’ in Henri Lefebvre’s terms of socially constituted spatialities. 3 When services like Google Maps or Nextdoor tell you where you are, they are also helping to call that ‘where’ into existence. As Mark Graham et al. point out, ‘a restaurant omitted from a map can cease to be a restaurant if nobody finds it.’ 4
While scholars across a range of disciplines have begun to examine location-based services as sources of data about urban life, 5 and have powerfully critiqued the political economy of smartphone apps and other services made possible by advertising-led ‘surveillance capitalism,’ 6 relatively few have focused on the way that they function as software. 7 Patrick Svensson and Erica Robles-Anderson have noted that while the popular press routinely makes hyperbolic claims about the dominance of algorithms and computation in contemporary life, “the material conditions of mundane software use go largely under-recognized as key sites for cultural work.” 8 Along those lines, Dodge et al. have called for a research bringing geographical approaches to software studies, ‘examining the power of code enacted spatially’ by governments and corporations in an era of pervasive computing. 9 On one level, what could be more mundane than the designation of neighborhood boundaries on digital maps? Nevertheless, simple decisions about how to represent urban neighborhoods in software (tag or object, point or polygon, user-contributed or fixed, overlapping or discrete, public or private) have profound consequences, even for people who abstain from using these services. 10
This paper is organized as follows. First, a genealogy of the dominant approach to urban neighborhood boundaries in location-based services and geoweb applications, that of enclosed polygonal areas. This is followed by a brief review of the ways geospatial software developers represent neighborhoods, categorized by a series of decisions about spatial data storage and display, and then a discussion of the ways that spatial data structures become enmeshed in broader social struggles around the fragmentation and commodification of urban life. This is followed by an extended case study of the local social network Nextdoor, considering some of the social and political implications of the choices its developers made in dividing urban space. The paper concludes with a consideration of alternatives to the fully legible digital spatial imaginary outlined in the preceding sections, both already existing and speculative.
I. The Prehistory of the Polygonal Neighborhood
For such an everyday concept, ‘neighborhood’ is remarkably hard to define with any consistency. If, as Barry Smith and David Mark have argued, even tangible geographic objects like mountains are abstractions selected somewhat arbitrarily from a continuous field of changing elevations, how could something as socially constructed as a neighborhood be any clearer? 11 Confusing matters further, most neighborhoods in Anglo-American cities lack firm official borders, assuming vastly different shapes depending on the person or institution dividing up space. 12 Compared to a legally defined spatial unit like Alameda County or New York City, which only change their names and boundaries due to bureaucratic deliberation or acts of war, different people and institutions drastically change the shape and size of neighborhoods to meet their needs, from realtors to activists, school boards to churches. 13 A few American cities do have official neighborhood designations, like Atlanta’s ‘Neighborhood Planning Units,’ started in 1974 by the city’s first African-American mayor, Maynard Holbrook Jackson, to help devolve municipal power to local areas and give historically underrepresented populations a voice. 14 More commonly, though, municipalities are divided up into city council districts, wards, or other political units that may span multiple neighborhoods as understood by their residents. Many neighborhoods take their name from speculative housing developments or the efforts of realtors to rebrand formerly low-status areas in order to command higher prices on the market. Sometimes underlying features in the natural or built environment play a role in stabilizing neighborhood boundaries, with features like rivers, hills, railroad tracks and highways neatly dividing different areas, but these relatively clear delineations rarely cover an entire city. 15 The widespread North American practice of building on a regular grid plan, with roots in biblical, classical, and Spanish imperial models, makes it easy for both governments and business interests to carve arbitrary spatial units out of an undifferentiated surface, and for those neighborhoods to expand, contract, and supplant each other over time. 16
In his discussion of the gentrification of the South Brooklyn waterfront around the turn of the 21st century, sociologist David Madden refers to named urban neighborhoods as ‘spatial projects’ put forward by specific classes and interest groups; real estate developers pushing to rebrand formerly disinvested neighborhoods across cities in North America and Europe, urban politicians looking to attract tourists and businesses, and affluent homeowners and renters aiming to reshape their surroundings. 17 Madden refers to this kind of abstract governable space as ‘the Westphalian neighborhood imaginary.’ 18 Westphalian neighborhoods are clearly circumscribed and non-overlapping, like the checkerboard of sovereign European states that emerged from the ashes of the Thirty Years War in the 1648 Peace of Westphalia. Madden characterizes this way of seeing urban neighborhoods, which dominates contemporary social scientific literature around neighborhood effects and opportunity, as naturalistic, depoliticized, ahistorical, and functionalist. 19 The Westphalian neighborhood is an organic expression of social groups, with clear borders that remain relatively fixed over time, unlike Madden’s study area in Brooklyn, which over just a few decades cycled through a series of names, spatial divisions, and land uses. The prevailing attitude towards urban space as a neutral container in neighborhood discourse can be traced back to three main sources: the post-Enlightenment nation state, early 20th-century American social science, and the real estate profession.
Perhaps unsurprisingly, systematically delineated secular neighborhoods covering an entire city are a legacy of the Western Enlightenment, as a dialectical echo of earlier absolutist and theocratic modes of ordering urban space. Numbered Parisian arrondissements were first designated in 1795, the same year that the French Revolutionary government adopted the meter as unit of measure, in the same spirit of standardization and rationalism. Each arrondissement contained four smaller ‘revolutionary sections’ created to channel popular political participation, themselves a reaction against both traditional Catholic parish borders and Louis XIV’s ‘quarters’ named in 1701 to consolidate control over the Parisian masses. In 1859, Napoleon III and Baron Haussmann expanded the arrondissements from twelve to the current twenty; their passion for exact spatial coordination also led to the first accurate cadastral map of Parisian property ownership in 1853. According to geographer David Harvey, however, while Haussmann’s spatial reforms aimed to make Paris more governable, loyalties to the new arrondissements became vital in building neighborhood and class solidarity in the Paris Commune of 1871. 20 Dividing up a territory into discrete units to be studied and managed was part of a broader trend in European nation-states towards statistical governmentality in the 19th century, a series of state spatial projects in which cartography played a crucial role. Jeremy Crampton notes that Baron Charles Dupin created the first choropleth map (a thematic map using differential shading of areas to communicate statistical information) in 1826 to show the percentage of male children enrolled in school in each region, mapping Enlightenment’s progress from “la France obscure” to “la France éclairée.” 21
In the 1920s, the Chicago School of urban sociology combined Haussmann’s love of abstract order with an ethnographic eye for the particular, naming and mapping 77 ‘community areas’ in Chicago, aiming to represent neighborhoods in spatial units larger than the newly defined census tracts and unchanging over time. 22 As Madden notes, this project lined up well with common ideological attitudes towards urban neighborhoods within the group. 23 Before long, city planners like Clarence Perry, who worked on the influential 1929 First Regional Plan of New York were urging rapidly expanding cities to engineer ‘neighborhood units,’ self-contained social worlds each centered on a local school. 24 Perry thought that the coherence of the urban environment had been gravely disturbed by the introduction of railroads and highways ‘divid[ing] the city into new neighborhoods,’ resulting in both the opportunity and the desperate need to define and standardize urban communities in the face of the ‘automobile menace.’ 25 To a large extent, Perry was mourning a village-like vision of city life that never fully existed. While today Brooklyn is a globally known brand name signifying urban authenticity, according to historian Suleiman Osman, the borough consisted of large nameless swathes of tenements and townhouses between port and industrial areas until the 1940s; early efforts to ‘locate Brooklyn’s authentic neighborhoods’ were carried out by ‘two groups of outsiders with very different motives: community organizers and real estate agents.’ 26 Starting in the early 20th century, developers laying out new suburbs along those expanding rail and road networks used federal housing incentives and racially restrictive covenants to build thousands of ready-made communities on greenfield sites with shared aesthetics, buyer demographics, and brand names, many of which still persist as neighborhood names on maps and in location-based services today. 27
II. Digital Neighborhoods as Bounded Objects
How do geospatial software developers choose to represent urban neighborhoods? Many encode neighborhoods as discrete, named polygons, composed of linear boundaries enclosing homogenous areas, a version of the Westphalian spatial imaginary in software. In its purest form, these districts touch without overlapping, and cover the full territorial extent of the city. Figure 1 is a map of San Francisco created using the neighborhood boundary shape files from Zillow, a Seattle-based company that represents over 60% of the online real estate market, with over 70 million monthly unique users. 28 This image is a visualization of an underlying data structure that sorts new listings on the site into neighborhoods that prospective homebuyers can use to filter their searches. With the exception of Golden Gate Park, the Presidio (overseen by the National Park Service), and a few outlying docks, every parcel of land in the city is assigned to one and only one neighborhood. This total view of the city, with named, non-overlapping, polygonal neighborhood boundaries, is broadly representative of the way a variety of contemporary geospatial services represent urban space. Crossing the street, a prospective homebuyer moves from one neighborhood to another in an instant. This kind of spatial data structure is easy to implement, and aligns well with the way many external data are already formatted, from Census reports to geodemographic analyses of customer behavior. Geographer Helen Couclelis points to a fundamental problem in using software to represent space, namely the ‘discrepancy between the boundary-poor empirical world […] and the boundary-happy technology’ that we use to understand and manipulate it. 29 GIS software has historically relied on two different spatial data models, each with its own affordances and ontological assumptions. Raster models divide up the area being represented into a grid of equally-sized cells, and contain information about variables (rainfall, land cover, elevation) for each cell. They are well suited for working with remote sensing data and analyzing natural phenomena that are not territorially bounded, but since cell resolution affects the shape of the data, and information is stored at every point, they can be slow to render, and have trouble dealing with neat political boundaries. Vector models, on the other hand, represent the world using points, lines, and polygons, storing only objects of interest like roads, land parcels, and governmental units, allowing for faster analysis and visualization of spatial objects that don’t encompass an entire area, and features that retain their shape at any scale. Contemporary geoweb services primarily rely on vector models, which share the ontological characteristics Crutzen and Kotkamp describe as basic to object-oriented programming, in which ‘the sequence in the modeling process—first classification and then instantiation—renders some phenomena incomplete or not represented at all.’ 30 Seeing the city like a database has the potential to cut off debate about the diverse character of urban space, and represents a mostly unnoticed arrogation of authority over representing the world by private technology firms. 31 When digital neighborhoods change their borders or get added or deleted over time, it is typically through opaque interventions by developers or designated power users, not by government legislation or through open negotiation in the public sphere.
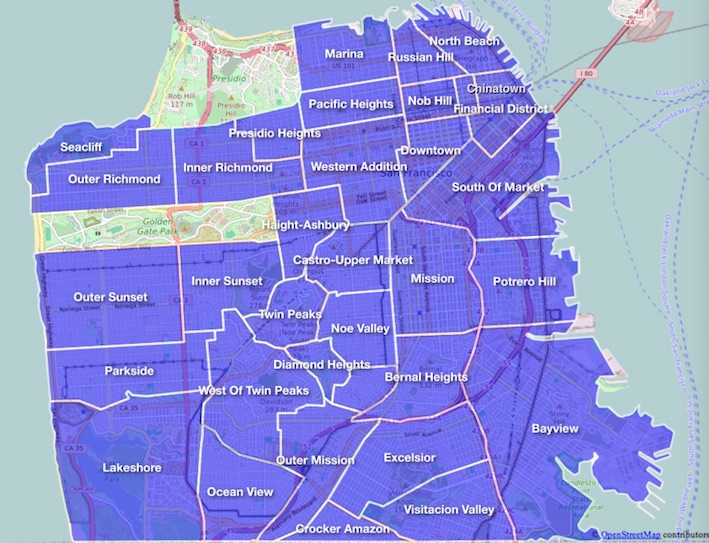
Figure 1. San Francisco’s neighborhoods as defined by real estate website Zillow
Political scientist James Scott uses the concept of “legibility” to describe state-led projects to make land tenure and property regimes easier to control from outside through imposing systems of top-down order, citing examples like the development of scientific forestry in Prussia and Baron Haussman’s broad Parisian boulevards to aid circulation and control. 32 Table 1 ranks a list of geospatial services by how closely their depiction of neighborhoods matches the Westphalian ideal, as expressed through a series of decisions in how they handle geospatial data. The platforms are presented in descending order of how ‘legible’ the urban neighborhood boundaries they depict are, ranked by adding up positive answers to the following questions:
• Are the boundaries for each neighborhood mapped polygons, so that a user can easily see their extent in a plan view?
• Are the neighborhoods in each system discrete and non-overlapping, so that each point in space belongs to one neighborhood?
• Does the system of bounded neighborhoods fill all space within the city, with a neighborhood designation for every point?
• Is there a clear nested hierarchy grouping sub-neighborhood areas into neighborhoods or neighborhoods into broader regions of the city?
• Does each neighborhood have a name that attempts to either line up with conventional usage in the area or propose a new designation?
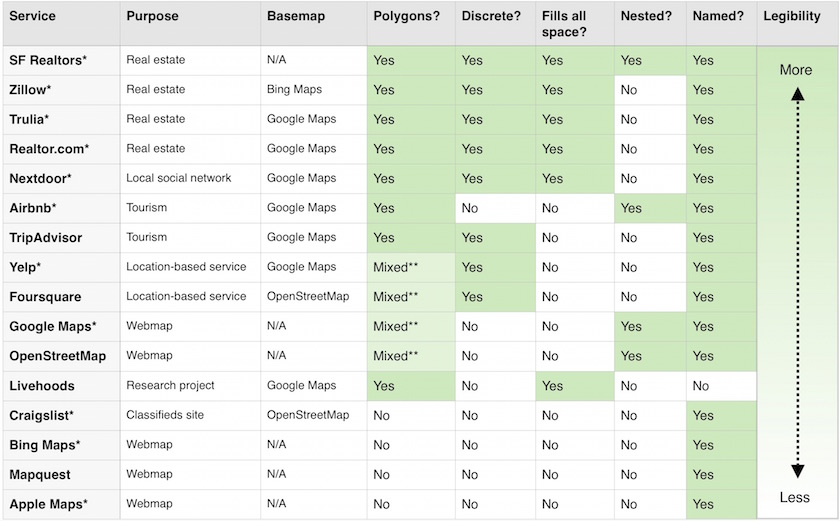
Table 1. Location-based services on a legibility scale
* These companies are all headquartered in the San Francisco Bay Area or Seattle.
** Google Maps and Yelp display polygonal neighborhood boundaries in desktop applications only, not on mobile devices. Foursquare never displays neighborhood boundaries, but uses them on the backend to sort listings in search results. As a free and open source collaborative mapping project, OpenStreetMap allows both point and polygonal neighborhood locations.
Most location-based services, especially those associated with tourism and real estate, like Zillow and Airbnb, fall on the more legible end of the spectrum, followed closely by local social network Nextdoor (see Section III). By standardizing neighborhood boundaries through software, services like Zillow make the city more legible to realtors and prospective homebuyers and sellers. This elective affinity between specific uses and data formats reveals the increased importance of subdividing and branding space for those who intend to profit from its sale or lease. A blog post by several senior Airbnb engineers makes it clear that cities themselves, not individual rental apartments and houses, are the company’s real product; ‘if Apple has the iPad and iPhone, we have New York and Paris.’ 33 Note that only Craigslist and Foursquare use free and open source project OpenStreetMap (OSM) for their base spatial data layer, while most of the real estate services use Google Maps, though they all use substantially different neighborhood boundaries. These services typically use a variety of government, realtor, commercial, and user data, in addition to a significant amount of discretion, to decide where to draw neighborhood boundary lines. 34 Airbnb, in particular employs a staff cartographer charged with determining the location of neighborhoods in popular cities, helping the site’s developers and users ‘understand a place without ever having been there.’ 35 Zillow is the only service to use a basemap besides Google or OSM, from their Seattle neighbor Microsoft’s Bing Maps unit. Bing Maps, like Apple Maps and Mapquest, primarily concerned with navigation from point A to point B, only represent neighborhoods as points, while Google Maps and OpenStreetMap, both projects aiming to impose order on geographic knowledge (and earn a profit, for Google), use polygons in some applications.
Scholars have noted useful analytic distinctions between different kinds of neighborhoods, many of which apply instructively to the digital neighborhoods represented by systems like Zillow. These areas have borders that are set by fiat, 36 and owe their existence to organizations; 37 they are made manifest in custom, procedure, and increasingly in code, but not usually in law. They are real estate neighborhoods, not policy neighborhoods, in geographer David O’Sullivan’s terms: consider the difference between Zip Code 94110 and the ‘Mission District.’ 38 The former, which covers most of the territory common to definitions of the neighborhood, was devised to meet the needs of a government agency (in this case, the U.S. Postal Service). The latter is a historical reference to the city’s founding Franciscan Mission, an emblem of Latino cultural pride, a flashpoint in debates over gentrification, and a brand name used to help prospective homebuyers locate and evaluate urban property. Finally, Zillow’s neighborhood borders are examples of Kitchin & Dodge’s ‘coded space,’ but not ‘code/space’; insofar as the Mission exists, it both antedates and does not rely on code stored on Google or Zillow servers, but these and other digital services are increasingly mediating the way people understand, navigate, and value urban space. 39 In the process, software is increasingly constituting space itself, constantly bringing it into being, in a dynamic that Kitchin & Dodge call ‘transduction,’ after Adrian Mackenzie and Gilbert Simondon. 40 As Wendy Chun notes, in an era of ubiquitous computing, the machines we use every day ‘have become metaphors for the mind, for culture, for society, for the body, affecting the ways in which we experience and conceive of “real” space.’ 41
III. The Spatial Politics of Digital Neighborhoods: Contested Boundaries and Names
How does the spatial imaginary of polygonal urban neighborhoods as depicted by a variety of geospatial services intersect with issues like gentrification, urban development, and policing? There are three main ways in which digitally defined neighborhoods assume importance within contemporary urban politics: contested boundaries, contested names, and what might be called the social effects of neighborhood scale, the way that certain services’ programmed delineations of neighborhood affect how their software functions. All are consonant with Madden’s characterization of neighborhoods as ‘spatial projections of social power,’ drawing on the work of Neil Brenner and Henri Lefebvre. 42 According to Lefebvre, in accord with his broader arguments about the social production of space, urban neighborhood names which seem to ‘designate places and the qualities of space in fact refer only to social relationships embedded within an indifferent space.’ 43
Despite the aura of permanence in Zillow’s wall-to-wall coverage of San Francisco neighborhoods, realtors’ maps of the city are regularly in flux. Geographers refer often to what Stan Openshaw famously coined the ‘modifiable areal unit problem,’ in which choosing different units of spatial analysis (counties, ZIP Codes, census blocks) can drastically change the results of the analysis. 44 For realtors, however, the arbitrary nature of spatial divisions creates an opportunity to continually redraw the boundary lines of urban areas, creating more supply of neighborhoods that are in demand. In 2012, San Francisco Association of Realtors (SFAR) revised their maps of the city, annexing portions of less-attractive areas to the upscale districts of Noe Valley and Glen Park. According to the San Francisco Chronicle, realtors looking to increase property values wagered that ‘a friendly name or boundary change can add to the size of a hot community or transform a neighborhood with a sketchy reputation.’ 45 Sometimes named neighborhoods do not just expand and contract, but subdivide or supplant each other entirely, usually due to the efforts of local civic and commercial elites, the urban ‘growth machine’ in sociologist Harvey Molotch’s terms 46 In addition to adjusting existing boundaries, SFAR also created entirely new neighborhoods like ‘Yerba Buena’ and ‘Candlestick Point’ out of portions of the historically stigmatized ‘South of Market’ and ‘Bayview’ neighborhoods, the latter one of the few remaining working-class African-American neighborhoods in a city that has been rapidly shedding minority and lower-income residents in the recent tech boom. 47 In an interview about the boundary changes, deputy director of the SFAR Jay Cheng denies any foul play, appealing to mundane technical requirements by claiming that ‘all it is is a database’ of available homes, divided up because realtors and homebuyers ‘need to be able to say, “This is in that neighborhood”’ definitively to avoid confusion or dishonesty. 48 The database must be complete; all space must be filled, and the realtors setting the boundaries are disinterested technicians. 49
The sheer variety and absurdity of real estate neologisms for urban neighborhoods is a ripe subject for parody; cult comedy television show Portlandia, filmed and set in Portland, Oregon, featured two stop-motion hipster rats debating what to call their new neighborhood north of Highway 405, over the bridge: ‘No-Fo-O-Fo-Bridge’? Like many trends in North American urbanism, some of the earliest and most prominent cases can be found in New York City. 50 By the second half of the twentieth century, as Manhattan elites sought to banish manufacturing from the urban core, artists and community groups advocated for the creation of new ‘live-work’ warehouse districts in SoHo and TriBeCa. 51 Art collectors soon followed the subjects of their patronage into downtown lofts, now some of the most expensive pieces of real estate in the world. Similarly, Madden sees the Walentas brothers’ large-scale redevelopment of industrial buildings ‘down under the Manhattan Bridge overpass’ starting in the 1980s into the luxury arts district ‘Dumbo’ as a material-discursive spatial project, displacing alternative identities for this area of the South Brooklyn waterfront, and writing nearby public housing projects and their residents out of the neighborhood’s ‘creative class’ narrative. 52
In the San Francisco Bay Area, a group of realtors has recently attempted to rebrand several neighborhoods in North Oakland, Berkeley, and Emeryville together as ‘NOBE,’ welcoming the diaspora of homebuyers priced out of San Francisco to a paradise of urban farming, bike lanes, and single-origin coffee bars. Some long-time residents of the area – a predominantly African-American area historically known as Golden Gate – see this digitally defined enclave of gentrification as the product of increasing police surveillance of minority Oaklanders. As Terra Graziani points out, realtor Linnette Edwards’ definition of NOBE overlaps almost entirely with the 2011 map of the North Oakland gang injunction zone from the Oakland City Attorney’s website. 53 These new spatial projects led by local development interests show how city and neighborhood place branding, in the words of Medway and Warnaby, ‘begins to commodify the place itself [by] giving it a coherent brand identity.’ 54 Place branding overwhelmingly concentrates its benefits, higher property values, among homeowners and developers, leaving long-time tenants, small businesses, and marginalized populations behind. Some activists and politicians have moved beyond satire to counter the proliferation of invented names spreading through their neighborhoods. As reported on public radio show and podcast ‘99% Invisible’ discussing the ‘SoHo effect,’ in 2011, Brooklyn assemblyman Hakeem Jeffries introduced an unsuccessful bill to prohibit realtors from inventing neighborhood names, a kind of semiotic rent control. 55 Asked about the bill, the Real Estate Board of New York’s Michael Slattery put forth the tautological defense that ‘is difficult to legislate the use of an official name when these neighborhood names are not legally defined,’ echoing the SFAR’s appeal to the need for realtor-controlled naming schemes. 56
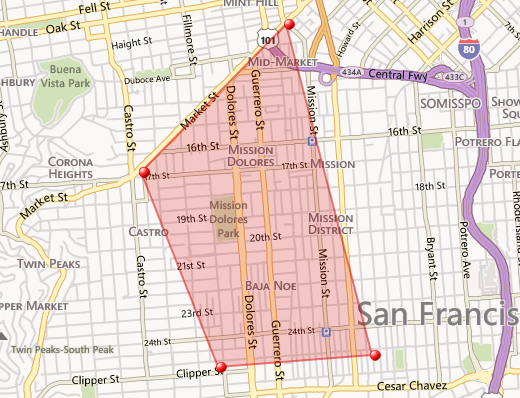
Figure 2. ‘The Quad’ as defined by San Francisco realtor Jennifer Rosdail
Part of the reason for the recent explosion in real estate neighborhood names may be the fact that contemporary online mapping tools make it so easy to create and disseminate them. This lowering of barriers to making maps has allowed for a variety of new geographic divisions to proliferate, some of which even reference their own creation from the top-down view of digital mapping software. When realtor Jennifer Rosdail wanted to describe a new neighborhood on the borders of the Castro, the Mission District, and Noe Valley attracting wealthy tech workers (including Facebook founder Mark Zuckerberg) in the wake of Facebook and Twitter’s initial public offerings (IPOs), she traced a crude trapezoid with digital pushpins on a Bing Maps screenshot and called the resulting polygonal hot spot ‘The Quad – A Newly Defined Meta Hood’ (see Figure 2). 57 Across the bay in Oakland, Linnette Edwards used Google MyMaps to trace her definition of ‘NOBE’ directly as an overlay to Google Maps. San Francisco blogger Burrito Justice used the same tool to create a number of semi-sarcastic ‘microhood’ names, including ‘La Lengua,’ a tongue-shaped protrusion from the Mission District below Cesar Chavez Street, which is now part of Google’s official map of the city, despite widespread ridicule from local businesses and longtime residents. 58
IV. The Social Effects of Neighborhood Scale: Racial Profiling on Nextdoor
Some digital platforms not only support existing spatial projects of externally created neighborhoods, but divide the world up into bespoke areal units for their own purposes. Popular local social network Nextdoor, founded in 2010 by serial entrepreneur Nirav Tolia (previously a cofounder of crowdsourced product review site Epinions in 1999, now owned by eBay, and currently defunct sports media site Fanbase.com in 2008), serves as a combination of online community bulletin board and neighborhood watch, with membership restricted to residents in particular physical locations. The company sends new users codes in the mail or verifies billing addresses to prove their residence, a literal geocoding of subjects that runs against the techno-libertarian tendency to anonymous, deterritorialized identity on much of the Web, aligning more closely with Facebook founder Mark Zuckerberg’s goal of having only one identity linked to a real name for every Internet user. 59 Posts are by default only visible in your own neighborhood, and can only be shared within a relatively small radius of adjacent ones, but sponsors and government agency partners like local police departments can send city-wide messages. 60 Public agencies are able to do this for free, since their participation is part of the value proposition to residents getting up-to-the-minute information about local safety and services.
Nextdoor has secured over $210 million in venture capital funding from firms including Kleiner Perkins Caufield & Byers, Benchmark Capital, Google Ventures, and Bezos Expeditions (owned by Jeff Bezos, Amazon’s founder). In its most recent Series D equity funding round in 2015, Nextdoor was valued at over $1 billion, making it a “unicorn” in Silicon Valley jargon, in large part due to its ambition to scale quickly to cover every neighborhood in America and offer this audience to advertisers. By 2017, the company had sponsored posts from national brands including Lyft, AT&T, Care.com, and Ring home security, key to their long-range plans to reach profitability, along with local business advertising comparable to local search services like Yelp or Angie’s List and a “Real Estate” section generating additional revenue from referral links to local realtors’ websites. In a clue to their target demographic, after signing up to start a neighborhood, the first prompt Nextdoor gives users is to “tell your spouse about Nextdoor” to make sure they get important local updates. 61 As Benchmark Capital general partner Bill Gurley, who has funded Tolia’s companies since Epinions, puts it, Nextdoor is aiming to be a “substitution of Craigslist,” an idiosyncratic privately-held local classifieds website that has resisted most efforts to monetize their massive audience through corporate partnerships and advertising; he has also referred to the site as “Facebook for your neighborhood”. 62 Facebook and Google, for their part, have been steadily increasing their footprints in local search and communications; Facebook’s Recommendations feature allowing users to request and offer advice about local business, which launched in 2016, is almost identical to Nextdoor’s feature of the same name, and both compete with Yelp and Google Local’s aggregated business reviews.
Unlike realtors, who look to both reflect and create ‘common sense’ neighborhood definitions, Nextdoor is most concerned with boundaries that create active communities, regardless of their fidelity to conventional definitions of place. 63 Users seeking to start new neighborhoods have twenty-one days to convince ten of their neighbors to join the site, like a digital reenactment of the 19th-century Homestead Acts requiring land claims in the Western United States to be improved to take title. Successfully launching a neighborhood is one of several ways for an ordinary user to become a ‘Lead,’ with greater powers to moderate discussion, adjust neighborhood boundaries, block membership, and promote other members to Lead, all on a strictly volunteer basis. Nextdoor’s home city of San Francisco provides stark examples of the spatial fragmentation that ensues from these bottom-up structures, in which early adoption by wealthier residents creates fewer, smaller neighborhoods in high-rent districts. Within a few blocks of City Hall, there are two Nextdoor ‘neighborhoods,’ named ‘Post International’ and ‘601 Van Ness,’ that consist of solitary luxury condominium buildings in otherwise mixed-income areas, islands within the ‘North Civic Center’ neighborhood (see Figure 3). These elite enclaves lie within San Francisco’s Western Addition, historic heart of the city’s African-American community and the hardest hit by postwar urban renewal, which cleared the land now occupied by these buildings of housing considered blighted. Even half a century later, social disparities between old and new residents inform the spatial organization of digital neighborhoods on Nextdoor, insulating recent arrivals from their surroundings.
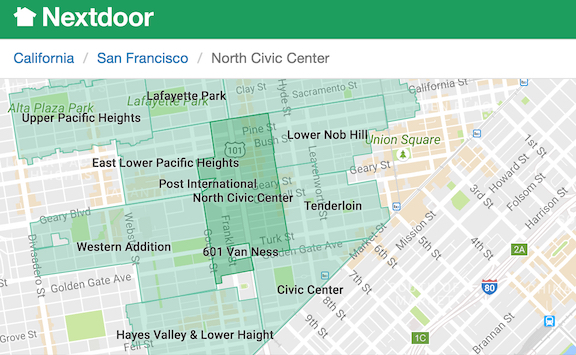
Figure 3. A selection of Nextdoor neighborhoods in central San Francisco (Author 2016)
By allowing wealthy homeowners to self-segregate among their immediate neighbors and ignore people in surrounding working-class districts, these Nextdoor neighborhoods resemble the aristocratic suburbs that resisted incorporation into their adjacent metropolitan cores in the early 20th century, enclaves like Piedmont, CA (surrounded by Oakland) and Brookline, MA (almost entirely encircled by Boston). Urban historian Kenneth Jackson describes the primary motive for resistance to annexation as the opportunity to be ‘encapsulated from the crises of urban capitalism, yet able to benefit and enjoy the system’s largesse.’ 64 Unlike these municipal examples, Nextdoor is not restricting the flow of tax revenue to surrounding communities, but by imposing a restrictive definition of ‘neighbor,’ one that changes in scale depending on socioeconomic status, the service creates a geographically enacted version of Eli Pariser’s ‘filter bubble,’ in which only the residents nearest to you become part of your community, and outsiders are considered untrustworthy or ignored. 65 One Nextdoor resident interviewed in a 2014 study referred to an ‘island effect’ when using the service, leading to situations where residents ‘don’t care what happens across the street.’ 66 Journalists have also compared Nextdoor neighborhoods to gated communities, with unyielding polygonal boundaries serving as gatekeepers and run by free labor from Nextdoor Leads. 67
Why is this digital cloistering of wealthy individuals in small areas an issue? Using platforms like Nextdoor, digitally-savvy residents have the potential to redirect law enforcement priorities toward preventing property crimes in rich neighborhoods. In a radio interview discussing the Seattle Police Department’s partnership with the site, Seattle Mayor Ed Murray noted his frustration that most complaints on Nextdoor are not from areas that have ‘significant crime problems, which tend to be our communities of color in the south part of the city.’ 68 Like many aspects of the contemporary personalized digital media ecosystem, Nextdoor posts are opaque en masse. They are difficult to study systematically due to both their geographic segregation of access rights and restrictive terms of service that allow the site to ban journalists and activists for relaying speech conducted within their private online forum. Murray’s interview was given in response to the concerns of journalist Erica Barnett, who was briefly banned from Nextdoor for reporting on locals’ comments in a digital town hall with Seattle police. 69 Users of Nextdoor, digitally filtered by their home address to see only the concerns of their nearest neighbors, would have no way of knowing this, in contrast to their experience of previous media regimes like city-wide newspapers or local broadcasters, which continue to lose advertising revenue to challengers like Craigslist, Google, and now Nextdoor.
Evidence also suggests that the enthusiastic adoption of sites like Nextdoor could be reinforcing existing class and racial boundaries in increasingly divided cities, drawing lines between ‘us’ and ‘them’ and amplifying the voices of neighbors who want to use the site to profile people they consider outsiders, even those who may have lived in the area for generations. Filtering user interactions into smaller spatial units could be both an effect of how people perceive the class and racial makeup of their area, and an amplifier of existing prejudices. Sociologist Jackelyn Hwang’s interviews with residents of a gentrifying area in Philadelphia reveals a racial dimension to differing neighborhood spatial imaginaries, with white respondents referring to smaller spatial units with unconventional boundaries and names to exclude areas they perceived as high crime and lower status. 70 Minority residents, on the other hand, regardless of socioeconomic status or tenure in the area, defined their neighborhood as a larger area (‘South Philly’) with a single name, relatively consistent boundaries, and a rich African-American cultural history. Since economist Thomas Schelling proposed a crude agent-based model of urban segregation in 1971, in which individual agents move when the racial composition of their neighborhood approaches a given ‘tipping point,’ 71 scholars have been using these models to explore urban social dynamics. 72 Studies of agent-based models based on Schelling’s have found that giving each agent a wider radius of comparison (or ‘vision’) leads to stable mixed neighborhoods, even given a fairly substantial preference for living among members of the same group. 73 This is a troubling finding to consider when applied to Nextdoor’s self-selecting and segregating small networks.
In response to concerns over messages containing racial profiling of alleged criminals in Oakland, California, where over one fifth of the city’s households use Nextdoor, many Leads have used their power to stop debate and ban users who protest discrimination, citing them for ‘unhelpful’ activist responses to what they claim are disinterested posts that keep the community safe. 74 In doing so, these volunteer facilitators provide support for Madden’s claim that community groups are not inherently progressive, and can just as easily represent the interest of white middle-class homeowners whose goals align with real estate developers and speculators. 75 Writing about the uneven development of Los Angeles in the latter decades of the twentieth century, Mike Davis argues that ‘the most powerful “social movement” in contemporary Southern California’ is that of wealthy homeowners defending ‘home values and neighborhood exclusivity.’ 76
‘One African-American man claiming to be my neighbor just rang my doorbell. He wanted to know if I had a chain to move a car. He did NOT look nor sound like any neighbor I know.’ Oakland Nextdoor posting 77
Ultimately, racial profiling on Nextdoor became enough of a public relations liability that the company was compelled to intervene. After a series of articles exposed the extent of profiling in Oakland, and a local activist group called Neighbors for Racial Justice persuaded City Council members in the city to consider blocking participation on Nextdoor by city employees, including the police department, the company took steps to change user behavior. 78 In doing so, Nextdoor put its faith in a technical fix that seeks to enforce neighborliness through careful user experience design. If residents reporting crime or suspicious activity refer to a subject’s race, they also have to include information on at least two articles of clothing or other identifiers in order to post to the site. 79 Figure 4 shows a portion of the site’s code that checks to see if the user has entered anything in the “Race” category and mandates that the user include other identifying details if any are found. These details must include at least two of the following: hair, top (shirt, jacket, etc.), bottom (pants, skirt, etc.), and shoes. Information about the suspect’s age, build, or sex does not count toward the total, based on input from police officers who advocated for more specific visual descriptors. Despite what appears to be a reference to a server-side call to validate input against a list of racial terms, the algorithm in its current form is extremely blunt: any input in the “race” field, including nonsense text or fictional races like “Klingon” or “Wookie,” triggers the same response. These more detailed descriptions are then run through more algorithms looking for racially charged language and length, to ensure that the information is detailed and non-discriminatory according to the site’s standards. To determine whether a post’s language may be racist, the algorithm validates user input against a list of terms entitled “search_race_terms” stored on Nextdoor’s servers, unavailable for public scrutiny or contestation. Comprising fewer than forty lines of terse JavaScript, the ostensible solution for this epidemic of prejudiced online speech is simple: a few more lines of code, another if-then statement, another iteration of the algorithm, fine-tuned until neighbors can see each other as people. Of course, as Tolia admits in an interview with Stanford students, if Americans really “did know their neighbors, there would be no reason for Nextdoor to exist,” since the site mediates and monetizes communication between people who would otherwise remain strangers. 80
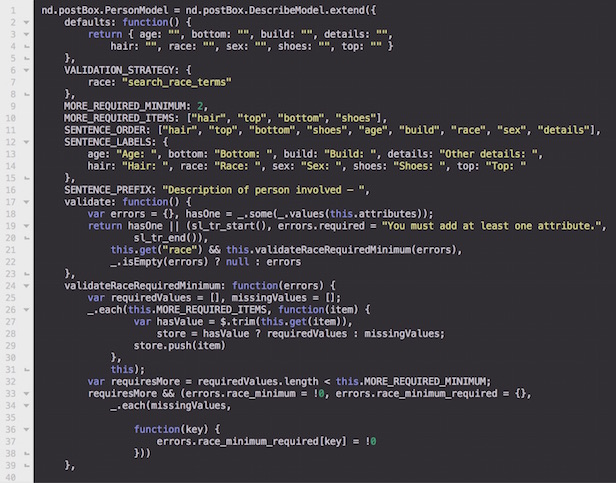
Figure 4. A section of JavaScript code validating Nextdoor user posts about suspicious people
While Nextdoor use has been highest in tech hubs like the Bay Area, Seattle, New York, and Boston, as of fall 2017, the site’s developers and users had created over 150,000 neighborhoods across the United States. As the company moves quickly into new markets, it sometimes relies on external data sources, not just user demand, to expand its polygonal grid, using boundaries from geospatial data firm Maponics to ‘robo offer’ ready-made neighborhoods in Minneapolis and other cities. 81 In 2016, Nextdoor launched networks in the Netherlands (allegedly chosen due to their reputation as civic-minded early adopters) and the United Kingdom, requiring the company to adapt to different norms around neighborhood boundaries and data privacy. 82 Unlike in North American cities, European neighborhood definitions tend to be relatively consistent across uses and over time, with municipal, census, and real estate neighborhoods overlapping much more closely. 83 As a result, Nextdoor is more concerned with replicating the names and boundaries used by local government agencies, and does not allow users to create their own neighborhoods at all in Europe. 84 In the United Kingdom, Nextdoor’s operational staff are also concerned with navigating the legal and social boundaries created by fortified ‘peace lines’ and legacies of political violence between neighborhoods in places like Northern Ireland. 85 One can only imagine the challenges in adapting the company’s sunny real estate worldview to other divided cities like Jerusalem or Beirut with ongoing inter-communal violence and struggles over uneven digital representations of place. 86
V. Beyond the Polygon: Rethinking Digital Neighborhoods
Beyond the problems outlined above relating to the commodification, fragmentation, and segregation of urban space, on a fundamental level the Westphalian spatial imaginary fails to align with the manifold personal experiences and interconnections that structure daily life in a city. Are there alternatives to the fully legible representations of space outlined above? How else can we base digital representations of urban neighborhoods? Some of the digital platforms included in Table 1 abandon various aspects of the conventional Westphalian neighborhood imaginary exemplified by real estate websites like Zillow, to various effects, while academics, artists, and cartographers have also experimented with other approaches. Table 2 illustrates a range of different approaches besides treating neighborhoods as discrete, non-overlapping named polygons that fill all space.
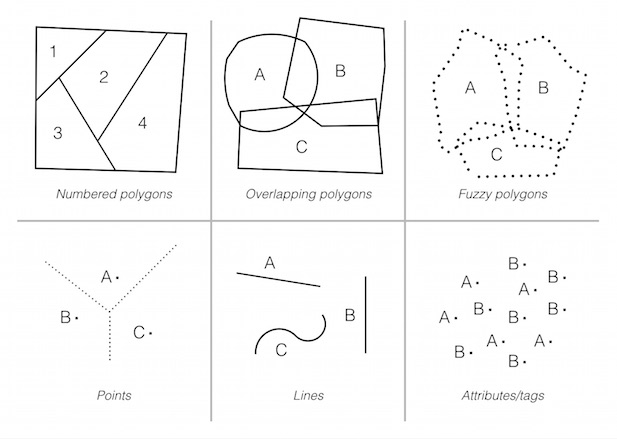
Table 2. A typology of alternatives to the Westphalian neighborhood imaginary
Numbered polygons
Geospatial software could eliminate the practice of assigning vernacular names to neighborhoods, but keep the concept of discrete areas of contiguous experience, designated by numbers instead. The Livehoods project at Carnegie Mellon uses the locations of Tweets and Foursquare check-ins to create de facto neighborhoods of lived experience, at least among heavy users of these social media platforms, by mapping areas where the same users tend to spend their time. 87 These areas are notably numbered, like Parisian arrondissements, but for a Big Data-era rationality, determining neighborhood boundaries inductively from many small observations of similarity, instead of imposing spatial order on a Cartesian territorial from above. Despite this vastly different epistemological basis, if Livehoods’ numbered areas gained wider recognition among residents, they might also develop identities as vivid as Paris’ numbered districts, which are often used as a short-hand reference for the different kinds of people who live there (bourgeois intellectuals in the 6th, jetsetters in the 16th, hipsters in the 11th, etc.).
Overlapping named polygons
Services like Yelp, Airbnb, and Google Maps employ a softer version of polygonal neighborhoods than the Westphalian spatial imaginary outlined above, in which multiple named neighborhoods can overlap and share space. Unlike real estate websites or Nextdoor, territorial exclusivity is less important in setting pricing or restricting access, and developers value complete, intuitive search results over a tidy ontology. If a user looking for a given restaurant, attraction, or place to stay might type in more than one neighborhood name, these services are content to meet them half-way and associate multiple names with given coordinates.
Fuzzy named polygons
An even more permissive approach accepts that neighborhoods exist as meaningful objects of analysis, but grants them indeterminate or shifting boundaries based on residents’ individual mental maps, following MIT urban planner Kevin Lynch’s method and goals in his research leading up to 1960’s The Image of the City. 88 In the terms of science studies, the concept of the neighborhood becomes a ‘boundary object’ (in this case, both literally and figuratively), providing a stable shared understanding across users and functions, without full agreement on its extent or ontological status. 89 A variety of academics, journalists, and programmers have experimented with this, methodology, usually relying on surveys or letting people draw their own boundaries on maps. A recent online project called Bostonography, created by Andy Woodruff and Tim Wallace, aggregates online responses tracing out neighborhood borders, bringing a potentially much larger group of people to bear on similar questions through digitally mediated participation. 90 This approach avoids some of the problems with Westphalian boundaries, but the resulting maps are only as representative of the broader society as their contributors.
Points
Neighborhoods can also be defined by points that are unequivocally part of a given named area, which gradually fade away into other neighborhoods as a user gets closer to points defining other areas. In The Image of the City, Lynch refers to points that structure residents’ spatial understanding of the city as ‘nodes’ and ‘landmarks.’ 91 Nodes are major intersections, public squares, or transitional zones between different modes of transit (Boston’s Copley Square or Los Angeles’ Civic Center), while landmarks are typically individual buildings or landscape features that people use to keep track of their position. From a software perspective, both can be represented as points, although in theory either would be better approximated at finer resolutions by a polygon in the shape of the given structure or open space (figure or ground, in architectural terms). 92
Examples of neighborhoods that emanate from a point include those named after particular marketplaces, transit stations, or intersections, like Covent Garden or King’s Cross in London, or San Francisco’s Haight-Ashbury. In theory, any neighborhood scheme composed of points could be ‘translated’ into a map showing polygonal neighborhoods by assigning all intervening areas to the nearest point, but in practice services that rely on point-based neighborhoods usually omit this step of spatial enclosure. OpenStreetMap (OSM) allows contributors to add points representing neighborhood nodes in the Lynchian sense (even referring to them as ‘nodes’ in its internal ontology). OSM only displays these nodes’ names at large scales, not in zoomed out city views like in Google Maps. In keeping with the messy open-source ethos of the project, however, contributors can also designate polygonal neighborhoods, more commonly in cities with defined administrative boundaries like Paris. 93 There is little consistency from place to place, reflecting the interests and experiences of individual contributors to the free, open-source mapping project. In Boston, the North End is a node, but the South End is a polygon, based on city inspection district data and exactly replicating the neighborhood’s boundaries in Google Maps. This is almost exactly the opposite of what Lynch’s study and the Bostonography project report: a clear polygonal shape for the North End, surrounded by shoreline and the old Central Freeway, and murky boundaries for the South End.
Lines
Neighborhoods defined only by lines, not enclosed into polygonal areas, may sound absurd given the power of existing spatial and technological convention, but there are some theoretical precedents for thinking this way. Many conventional neighborhoods are either named after or otherwise defined by specific linear stretches of urban thoroughfares; the Bowery in New York, the Embarcadero or the Fillmore in San Francisco. Kevin Lynch calls these prominent structuring elements of urban space ‘paths.’ 94 Other neighborhoods are defined by lines as edges. This is particularly prominent in real estate neighborhoods like New York’s SoHo (‘South of Houston Street’) and TriBeCa (‘Triangle Below Canal Street’) or San Francisco’s SoMa (‘South of Market Street’). As with points, any scheme assigning locations to the nearest neighborhood line would generate a polygonal equivalent, whether or not it was ever rendered.
Attributes/tags
Geospatial software developers can also treat a neighborhood name as a property, attribute, or tag in a database of objects, instead of an area containing these objects. This approach can overlap somewhat with the discrete polygonal neighborhood in practice, since users of LBS often see neighborhood names listed in the public view of a database object like a restaurant or shop, alongside other attributes like opening hours, price range, and user reviews, but this approach allows for non-contiguous neighborhood designations for individual urban features. Craigslist adopts this method, treating neighborhoods as floating concepts that are unilaterally named by the developers but are not tethered to any specific territory, mirroring the iconoclastic libertarian ethos of founder Craig Newmark. For example, a Craigslist search for Manhattan apartments in the ‘Financial District’ results in over 260 results in the vicinity of Wall Street and the World Trade Center, but about twenty clustered in various areas miles uptown or across the river in New Jersey. The Neighborhood Project, Matt Chisholm and Ross Cohen’s visualization of the actual locations of housing listings in Craigslist’s home city of San Francisco, color coded by the neighborhood name used for the posting, called, ends up looking like a pointillist exercise in Lynchian mental mapping (see Figure 5). 95
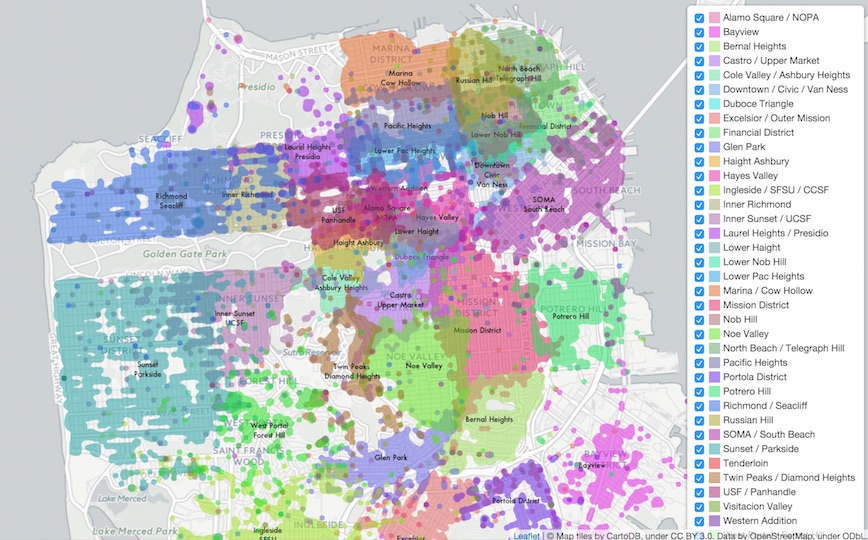
Figure 5. The Neighborhood Project map of San Francisco housing color coded by name
Exclusion
One approach would be to exclude urban neighborhoods entirely from geospatial software as irrelevant abstractions. In an age of GPS-enabled devices allowing coordinate locations to be fixed within a few meters, the need for intermediate spatial entities may be less urgent than in the days when businesses and city governments first standardized street addresses and neighborhood names. 96 If neighborhoods are an intermediate spatial concept that allow people to understand their surroundings through shorthand, do we still need them in an age where we can instantly fix our position and proximity to whatever we desire, whether a romantic partner, cocktail bar, or new luxury condominium? Did neighborhoods ever really mean much to residents in their daily lives, or was the reification of neighborhood just another artifact of post-Chicago School sociology and state or capitalist projects of legibility?
VI. Conclusion
‘Is it not possible for a sense of place to be progressive; not self-enclosing and defensive, but outward-looking?’ Doreen Massey, ‘A Global Sense of Place’ 97
It may be that all of these efforts to fix a particular ‘right’ way of ordering urban space into discrete neighborhoods miss the point. In an era where borders and walls are increasingly creeping back into political discourse and everyday life, perhaps it would be worthwhile to reexamine the borderings inherent to territorial units of community, and to assess what work they do, and which opportunities they close off. Even in the mid-20th century prime of positivist urbanism, there were dissenting voices, people who saw the discrete urban neighborhood as merely a convenient shorthand for social scientists and city planners, rather than a reflection of lived reality. British city planner Ruth Glass, best known today as the coiner of the term ‘gentrification,’ asserted in 1945 that ‘self-contained neighborhoods do not exist,’ since the boundaries of neighborhood life vary greatly for different people and activities. 98 Glass illustrated her point with a series of maps showing the diversity of where people shopped and which clubs they belonged to in the Bethnal Green area of East London, for example, displaying a patchwork of interpenetrating areas of influence that differ markedly for different family members and activities (food shopping, working outside the home, school attendance, club membership, etc.), belying the tidy functional districts of Le Corbusier and other male Modernist planners. 99 While Glass was right to point out the ways that urban life is too complex to fit into neat boundaries, the fixed urban neighborhood is a tool far better suited to the purposes of governing and marketing space. So for the most part we live in an urban world of neatly bounded neighborhoods, districts, wards, homeowners associations, and real estate names: the Westphalian neighborhood imaginary, in Madden’s terms, which is only reinforced by its prominence in geospatial software, especially services dedicated to tourism and real estate, as seen in Table 1.
Although many maps and location-based services use neighborhood names and boundaries to orient their users or brand urban space, as discussed above, Nextdoor integrates the bounded urban neighborhood as a primary element of its user experience and strategic plan. Nextdoor treats residential neighborhoods in the same way that Facebook does connections between people; as a medium through which information flows, generating increasing impressions and engagement on advertisers’ content over time. Social networks and neighborhoods existed long before they could be leveraged for digital communications platforms; what Facebook and Nextdoor offer is an operationalized or topological understanding of messy and contingent human experiences, one that is machine-readable and easily parsed by algorithms seeking to target advertising and encourage some behaviors over others. Nextdoor can be used to report street harassment or aid neighbors in a natural disaster, just like Facebook can be a powerful communication platform for activists and artists, but both services entice users with free accounts to generate and monetize massive audiences, with pernicious and opaque effects. Nextdoor’s focus on crime and integration of real estate listings bring together some of the most powerful tendencies of the “weapons of math destruction” Cathy O’Neill identifies as constraining democratic societies in the age of Big Data. 100 As Nextdoor and similar location-based services continue their rapid growth, corporations and governments have been increasingly using residential location to help determine not only the ads you see but the likelihood you may be approved for a mortgage or arrested, the interest on your loan or the length of your sentence. Given the long history of racial and class-based spatial segregation in American cities, the regressive effects of both geodemographic targeting and surveillance capitalism may reinforce each other as neighborhoods themselves become weaponized, and the more or less arbitrary polygons drawn on Nextdoor’s map by digital homesteaders delimit our social worlds.
Bibliography
Annechino, Rachelle, and Yo-Shang Cheng. “Visualizing Mental Maps of San Francisco” (MA thesis, School of Information, UC Berkeley, 2011).
Barreneche, Carlos. “The order of places: Code, ontology and visibility in locative media.” Computational Culture 2 (2012): 26.
Barreneche, Carlos. “Governing the geocoded world: environmentality and the politics of location platforms.” Convergence: The International Journal of Research into New Media Technologies 18, no. 3 (2012): 331-35
Bowker, Geoffrey C., and Susan Leigh Star. Sorting Things Out: Classification and its Consequences. Cambridge: MIT Press, 2000.
Brenner, Neil. New State Spaces: Urban Governance and the Rescaling of Statehood. Oxford: Oxford University Press, 2004.
Carbone, June, and Naomi Cahn. Marriage markets: How inequality is remaking the American family. Oxford: Oxford University Press, 2014.
Charkov, Maxim, Riley Newman, and Jan Overgoor. “Location Relevance… aka knowing where you want to go in places we’ve never been.” Airbnb Nerds Blog. May 1, 2013.
Chaskin, Robert J. “Perspectives on Neighborhood and Community: a Review of the Literature.” The Social Service Review (1997): 521-547.
Chisholm, Matt and Ross Cohen. “The Neighborhood Project.” http://hood.theory.org/ Accessed September 27, 2016.
Chun, Wendy Hui Kyong. Programmed visions: Software and memory. Cambridge: MIT Press, 2011.
Clift, Steven. “Public versus Private, Small versus Large – If NextDoor really was next door.” E-democracy.org. Aug 1, 2012.
Couclelis, Helen. “Towards an Operational Typology of Geographic Entities with Ill-defined Boundaries.” in Burroughs, Peter and Andrew Frank, eds. Geographic Objects with Indeterminate Boundaries. London: Taylor & Francis, 1996.
Crampton, Jeremy. “GIS and Geographic Governance: Reconstructing the Choropleth Map.” Cartographica 39, no. 1 (2004): 41-53.
Cranshaw, Justin, Raz Schwartz, Jason I. Hong, and Norman Sadeh. “The Livehoods Project: Utilizing Social Media to Understand the Dynamics of a City.” International AAAI Conference on Weblogs and Social Media. 2012.
Crutzen, Cecile and Erna Kotkamp. “Object Orientation.” in Matthew Fuller, ed. Software studies: A lexicon. Cambridge: MIT Press, 2008.
Dalton, Craig M., and Jim Thatcher. “Inflated granularity: Spatial “Big Data” and geodemographics.” Big Data & Society 2, no. 2 (2015): 2053951715601144.
Dangerfield, Andy. “Historic London Districts ‘Rebranded’ Midtown.” BBC News, September 17, 2010.
Davis, Mike. City of Quartz: Excavating the Future in Los Angeles. Verso Books, 1990.
Delevett, Peter. “Website Helps Neighbors Connect.” Los Angeles Times, November 7, 2011.
de Souza e Silva, Adriana. “Location-aware mobile technologies: Historical, social and spatial approaches.” Mobile Media & Communication 1, no. 1 (2013): 116-121.
Dodge, Martin, Rob Kitchin, and Matthew Zook. “How does software make space? Exploring some geographical dimensions of pervasive computing and software studies.” Environment and Planning A 41, no. 6 (2009): 1283-1393.
Feeney, Caroline. “Zillow Snags More Internet Market Share than Ever.” Inman. May 19, 2016.
Ford, Heather, and Mark Graham. 2016. “Provenance, Power, and Place: Linked Data and Opaque Digital Geographies,” Environment and Planning D 34, no. 6 (2016): 957-970.
Frith, Jordan. Smartphones as Locative Media. John Wiley & Sons, 2015.
Gans, Herbert J. The Urban Villagers: Group and Class in the Life of Italian-Americans. New York: Free Press of Glencoe, 1962.
Glass, Ruth. “Social Aspects of Town Planning.” The Architectural Review. March, 1945.
Gottlieb, Dylan. “Dirty, Authentic… Delicious: Yelp, Mexican Restaurants, and the Appetites of Philadelphia’s New Middle Class.” Gastronomica 15, no. 2 (2015): 39-48.
Graham, Mark, De Sabbata, Stefano, and Zook, Matthew. (2015) ‘Towards a Study of Information Geographies: (Im)mutable Augmentations and a Mapping of the Geographies of Information’, Geo, 2: 88–105.
Graziani, Terra. “North Oakland Gang Injunction.” Scales of Gentrification, December 15, 2013.
Harper’s. “Readings: If Looks Could Kill.” Harper’s Magazine, January 2016.
Harshaw, Pendarvis. “Nextdoor, the Social Network for Neighbors, is Becoming a Home for Racial Profiling.” Fusion, March 24, 2015.
Harvey, David. Paris, Capital of Modernity. Psychology Press, 2003.
Harvey, Francis, and Nick Chrisman. “Boundary objects and the social construction of GIS technology.” Environment and Planning A 30, no. 9 (1998): 1683-1694.
Harwood, Graham, and Matsuko Yokokoji. “Palinopsia.” Rhizome, January 8, 2015.
Haughney, Christine. “‘SoBro’ and ‘ProCro’ NoJoke to Assemblyman.” New York Times, April 19, 2011.
Hunter, Albert Dale. Symbolic Communities: The Persistence and Change of Chicago’s Local Communities. Chicago: University of Chicago, 1974.
Hutcheson Jr., John D. “Research Report: Citizen Representation in Neighborhood Planning.” Journal of the American Planning Association 50, no. 2 (1984): 183-193.
Hwang, Jackelyn. “The Social Construction of a Gentrifying Neighborhood: Reifying and Redefining Identity and Boundaries in Inequality.” Urban Affairs Review 52, no. 1 (2016): 98-128.
Jackson, Kenneth T. Crabgrass Frontier: The Suburbanization of the United States. Oxford: Oxford University Press, 1985.
Jacobs, Jane. The Death and Life of Great American Cities. New York: Vintage, 1961.
Kitchin, Rob, and Martin Dodge. “Code and the Transduction of Space.” Annals of the Association of American Geographers 95, no. 1 (2005): 162-180.
Kitchin, Rob, Tracey Lauriault, and Matthew Wilson. (eds.) Understanding Spatial Media. London: Sage, 2017.
Laurie, Alexander and Jaggi, Narendra “Role of ‘Vision’ in Neighborhood Racial Segregation.” Urban Studies 40 (2003): 2687–704.
Lefebvre, Henri. The Urban Revolution. trans. Robert Bononno. Minneapolis: University of Minnesota Press, 2003 (1970).
Lee, Jessica. “Nextdoor Flap Has Seattle Scrutinizing How it Handles Social Media.” The Seattle Times. March 14, 2016.
Leszczynski, Agnieszka. “Situating the Geoweb in Political Economy.” Progress in Human Geography 36.1 (2012): 72-89.
Leszczynski, Agnieszka, and Matthew W. Wilson. “Guest Editorial: Theorizing the Geoweb.” GeoJournal 78, no. 6 (2013): 915.
Levin, Sam. “Racial Profiling via Nextdoor.com” East Bay Express, October 7, 2015.
Logan, John R., and Harvey Molotch. Urban Fortunes: The Political Economy of Place. University of California Press: Berkeley, 2007.
Lynch, Kevin. The Image of the City. MIT Press: Cambridge, 1960.
Mack, Heather. “‘La Lengua’ Name Spurs New Merchant Group.” Mission Local, January 13, 2014.
Madden, David J. “Neighborhood as Spatial Project: Making the Urban Order on the Downtown Brooklyn Waterfront.” International Journal of Urban and Regional Research 38.2 (2014): 471-497.
Manovich, Lev. “The Poetics of Augmented Space.” Visual Communication 5, no. 2 (2006): 219-240.
Martin, Scott. “Nextdoor Comes Knocking with Neighborhood Network.” USA Today, October 27, 2011.
Masden, Christina A., Catherine Grevet, Rebecca E. Grinter, Eric Gilbert, and W. Keith Edwards. “Tensions in Scaling-up Community Social Media: A Multi-Neighborhood Study of Nextdoor.” Proceedings of the SIGCHI Conference on Human Factors in Computing Systems. ACM, 2014.
Massey, Doreen. “A Global Sense of Place.” Marxism Today. June 1991: 24-29.
Medina, Jennifer. “Website Meant to Connect Neighbors Hears Complaints of Racial Profiling.” The New York Times, May 18, 2016.
Medway, Dominic, and Gary Warnaby. “What’s in a Name? Place Branding and Toponymic Commodification.” Environment and Planning A 46, no. 1 (2014): 153-167.
Molotch, Harvey. ”The City as a Growth Machine: Toward a Political Economy of Place.” The American Journal of Sociology, Vol. 82, No. 2 (Sep., 1976), pp. 309–332.
Monmonier, Mark. Bushmanders and Bullwinkles: How Politicians Manipulate Electronic Maps and Census Data to Win Elections. Chicago: University of Chicago Press, 2001.
O’Donovan, Caroline. “Nextdoor Goes Dutch.” BuzzFeed News, February 16, 2016.
O’Neil, Cathy. Weapons of Math Destruction: How Big Data Increases Inequality and Threatens Democracy. New York: Broadway Books, 2017.
Openshaw, Stan. The Modifiable Areal Unit Problem. Norwich: Geo Books, 1983.
Osman, Suleiman. The Invention of Brownstone Brooklyn: Gentrification and the Search for Authenticity in Postwar New York. Oxford: Oxford University Press, 2011.
O’Sullivan, David. “Changing Neighborhoods—Neighborhoods Changing: A Framework for Spatially Explicit Agent-Based Models of Social Systems.” Sociological Methods & Research 37.4 (2009): 498-530.
Pariser, Eli. The Filter Bubble: How the New Personalized Web is Changing What We Read and How We Think. New York: Penguin, 2011.
Perry, Clarence A. 1929. “The Neighborhood Unit.” In Regional Survey of New York and Its Environs, vol. 7. New York: Committee on Regional Plan of New York and Its Environs.
Rao, Leena. “Here’s Where Neighborhood Social Network Nextdoor Is Moving Next.” Fortune, September 13, 2016.
Rosdail, Jennifer. “The Quad – A Newly Defined Meta Hood.” March 7, 2014.
Rose-Redwood, Reuben. “Indexing the great ledger of the community: urban house numbering, city directories, and the production of spatial legibility.” Journal of Historical Geography 34, no. 2 (2008): 286-310.
Rose-Redwood, Reuben, Derek Alderman, and Maoz Azaryahu. “Geographies of toponymic inscription: new directions in critical place-name studies.” Progress in Human Geography 34, no. 4 (2010): 453-470.
Sampson, Robert, Jeffrey Morenoff, and Thomas Gannon-Rowley. “Assessing ‘Neighborhood Effects’: Social Processes and New Directions in Research” Annual Review of Sociology 28 (2002): 443–478.
Schelling, Thomas C. “Dynamic Models of Segregation.” Journal of Mathematical Sociology 1, no. 2 (1971): 143-186.
Scott, James C. Seeing like a State: How Certain Schemes to Improve the Human Condition Have Failed. Yale University Press, 1998.
Shahani, Aarti. “Social Network Nextdoor Moves to Block Racial Profiling Online.” NPR All Tech Considered, August 23, 2016.
Shoff, Harrison. “Mapping the World.” Airbnb Code Blog. January 7, 2015.
Singh, Raj R. “Sketching the City: a GIS-based Approach.” Environment and Planning B 26, no. 3 (1999): 455-468.
Smith, Barry, and David M. Mark. “Do Mountains Exist? Towards an Ontology of Landforms.” Environment and Planning B 30, no. 3 (2003): 411-427.
Smith, Barry, and Achille C. Varzi. “Fiat and Bona Fide Boundaries.” Philosophical and Phenomenological Research (2000): 401-420.
Smith, Victoria. “Shape-shifting NYC neighborhoods: Why search sites differ on the boundaries, and how it affects your bottom line.” Brick Underground. September 15, 2016.
Star, Susan Leigh, and James R. Griesemer. “Institutional ecology, ‘translations,’ and boundary objects: Amateurs and professionals in Berkeley’s Museum of Vertebrate Zoology, 1907-39.” Social Studies of Science 19, no. 3 (1989): 387-420.
Stephens, Monica. “Gender and the GeoWeb: divisions in the production of user-generated cartographic information.” GeoJournal 78, no. 6 (2013): 981-996.
Stoica, Victor Ionut, and Andreas Flache. “From Schelling to Schools: A Comparison of a Model of Residential Segregation with a Model of School Segregation.” Journal of Artificial Societies and Social Simulation 17, no. 1 (2014): 5.
Svensson, Patrik, and Erica Robles-Anderson. “‘One Damn Slide After Another’: PowerPoint at every Occasion for Speech.” Computational Culture 5 (2016).
Trufelman, Avery. “The SoHo Effect.” 99% Invisible, March 15, 2016.
Turnquist, Kristi. “‘Portlandia’ Season 3: The rats will play.” The Oregonian, February 23, 2013.
Upton, Dell. Another City: Urban Life and Urban Spaces in the New American Republic. New Haven: Yale University Press, 2008.
van Dijck, José. “‘You have one identity’: Performing the Self on Facebook and LinkedIn.” Media, Culture & Society 35, no. 2 (2013): 199-215.
Waddell, Kaveh. “The Police Officer ‘Nextdoor.’” The Atlantic, May 4, 2016.
Wildermuth, John. “S.F. Neighborhoods Change Names to Map Out New Identity.” The San Francisco Chronicle, March 23, 2014.
Wirth, Louis. “Human Ecology.” American Journal of Sociology Vol. 50, No. 6 (May, 1945):483-488.
Woodruff, Andy. “Crowdsourced Neighborhood Boundaries, Part One: Consensus.” Bostonography. July 2, 2012.
Yeh, Chris. “CS183C Session 12: Nirav Tolia, Nextdoor.” Blitzscaling: Class Notes and Essays. October 29, 2015.
Zuboff, Shoshana. “Big other: surveillance capitalism and the prospects of an information civilization.” Journal of Information Technology 30, no. 1 (2015): 75-89.
Zukin, Sharon. Loft Living: Culture and Capital in Urban Change. Rutgers University Press, 1989.
Zukin, Sharon, Scarlett Lindeman, and Laurie Hurson. “The omnivore’s neighborhood? Online restaurant reviews, race, and gentrification.” Journal of Consumer Culture (2015): 1469540515611203
Notes
- Frith, Smartphones as Locative Media; Leszcynski and Wilson, “Theorizing the Geoweb.” ↩
- Manovich, “The Poetics of Augmented Space.” ↩
- Kitchin et al., Understanding Spatial Media. ↩
- Graham et al., “Information Geographies.” ↩
- See Zukin et al., “The Omnivore’s Neighborhood?” and Gottlieb, “Dirty, Authentic… Delicious,” for examples of discourse analysis of Yelp reviews to explore issues of gentrification and cultural authenticity in urban neighborhoods. ↩
- For example, Zuboff, “Big Other,” Leszczynski, “Situating the Geoweb in Political Economy.” ↩
- Exceptions include Barraneche, “The Order of Places” and “Governing the Geocoded World,” Dalton & Thatcher, “Inflated Granularity,” and de Souza e Silva, “Location-Aware Mobile Technologies.” ↩
- Svensson and Robles-Anderson, “‘One Damn Slide After Another.’” ↩
- Dodge et al., “How Does Software Make Space?” ↩
- For a foundational account of the role of categories in information systems, see Bowker and Star, Sorting Things Out. ↩
- Smith and Mark, “Do Mountains Exist?” ↩
- Mexican cities operate under a system closer to European cities, with official colonias that serve as defined units of vernacular neighborhoods, but lack political representation. French-settled cities like Montreal and New Orleans are a hybrid between French spatial precision (the cities are divided into arrondissements and wards, respectively) and the looser real estate-driven neighborhood boundaries common to adjoining Anglophone areas. ↩
- As part of their 2011 research project exploring the ways that San Francisco residents understand their city, Rachelle Annechino and Yo-Shang Cheng illustrate this by visually overlapping different neighborhood boundaries on the same map, including Zillow, the city’s Planning Department, and the Association of San Francisco Realtors, which often diverge widely, even among a group of services all broadly involved in city planning and real estate. (Annechino and Cheng, “Visualizing Mental Maps of San Francisco.”) Even official governmental boundaries are subject to manipulation by politicians, businesses, and lobbying groups through processes like gerrymandering of electoral districts for partisan advantage, annexation or secession of urbanized areas, or strategic manipulations of the spatial scale of decision making (either down to more local political units or up to higher levels depending on the interests involved); see Monmonier, Bushmanders and Bullwinkles and Logan and Molotch, Urban Fortunes. ↩
- Hutcheson, “Citizen Representation in Neighborhood Planning.” ↩
- See Kevin Lynch’s discussion of “edges” and “districts” in Lynch, The Image of the City. ↩
- Upton, Another City. ↩
- Madden, “Neighborhood as Spatial Project.” ↩
- Ibid. ↩
- See also Sampson et al., “Assessing ‘Neighborhood Effects’.” ↩
- Harvey, Paris, Capital of Modernity. Rueben Rose-Redwood et al. use Michel Foucault’s notion of ‘governmentality’ to describe how political technologies of addressing space which aim to impose objectivity also ‘produce new modes of subjectivity as geo-coded spaces become the condition of possibility for locating the place of the “self” and “others” in both social and spatial terms.’ (Rose-Redwood et al., “Geographies of Toponymic Inscription”) ↩
- Crampton, ”GIS and Geographic Governance.” By the 1860s, projects like Henry Mayhew’s choropleth maps of criminal statistics in England and Wales and the 1874 Walker atlas of the 1870 U.S. Census data, with particular attention to racial and ethnic composition of the post-war nation, demonstrated the evolving spatial logic of what Crampton calls a “rationality of calculability of populations.” (43) Governments and businesses still routinely use choropleth maps to display spatial data; online real estate platform Trulia uses a dynamically updated one to show local crime statistics around homes offered for sale. ↩
- Hunter, Symbolic Communities. ↩
- Madden, “Neighborhood as Spatial Project.” ↩
- Perry, “The Neighborhood Unit.” ↩
- Ibid. ↩
- Osman, The Invention of Brownstone Brooklyn. ↩
- Jackson, Crabgrass Frontier. ↩
- Feeney, “Zillow Snags More Market Share.” ↩
- Couclelis, “Geographic Entities with Ill-defined Boundaries.” ↩
- Crutzen and Kotkamp, “Object Orientation.” ↩
- And a small group of volunteer moderators, in the case of OpenStreetMap, who are more likely than not to be white men from Western Europe and North America; see Stephens, “Gender and the GeoWeb.” ↩
- Scott, Seeing Like a State. ↩
- Charkov, Newman, and Overgoor, “Location Relevance” ↩
- Smith, ”Shape-shifting NYC neighborhoods.” ↩
- Shoff, “Mapping the World.” ↩
- Smith and Varzi, “Fiat and Bona Fide Boundaries.” ↩
- Chaskin, “Perspectives on Neighborhood and Community.” ↩
- O’Sullivan, “Changing Neighborhoods—Neighborhoods Changing.” ↩
- Kitchin and Dodge, “Code and the Transduction of Space.” ↩
- Ibid. ↩
- Chun, Programmed Visions. ↩
- Brenner, New State Spaces. ↩
- Lefebvre, The Urban Revolution. ↩
- Openshaw, The Modifiable Areal Unit Problem. ↩
- Wildermuth, “S.F. Neighborhoods Change Names.” ↩
- Molotch, “The City as a Growth Machine.” ↩
- Wildermuth, “S.F. Neighborhoods Change Names.” ↩
- Ibid. ↩
- These fights predate digitally mediated neighborhood boundaries. Mike Davis describes how community designations in Los Angeles led to pitched battles around a proposal to move the “$20,000 sign” designating the border of the West Hills area a few blocks east, resisted by the lucky neighbors already inside the magic polygon (Davis, City of Quartz). ↩
- Turnquist, “‘Portlandia’ Season 3.” ↩
- Zukin, Loft Living. ↩
- Madden, “Neighborhood as Spatial Project.” ↩
- Graziani, “North Oakland Gang Injunction.” ↩
- Medway and Warnaby, “Place Branding and Toponymic Commodification.” ↩
- Trufelman, “The SoHo Effect.” ↩
- Haughney, “‘SoBro’ and ‘ProCro’ NoJoke to Assemblyman.” ↩
- Rosdail, “The Quad – A Newly Defined Meta Hood.” ↩
- Mack, “‘La Lengua’ Name Spurs New Merchant Group.” ↩
- van Dijck, “Performing the Self on Facebook and LinkedIn.” ↩
- Tolia describes the compromise the company struck between keeping local discussions private and allowing for “viral vectors” for wider sharing of Nextdoor posts to increase usage and advertising revenue by allowing the nearest 10,000 households to see your posts by default. (Yeh, “CS183C Session 12: Nirav Tolia, Nextdoor”) ↩
- According to census data, only half of American adults live with a spouse, though cohabiting married couples are more likely to have college degrees, earn high incomes, and own their homes, all important pieces of data to Nextdoor and its advertisers. (Carbone and Cahn, Marriage Markets) ↩
- Martin, “Nextdoor Comes Knocking with Neighborhood Network;” Delevett, “Website Helps Neighbors Connect.” ↩
- According to Tolia, Nextdoor turned to user-designated areas primarily because there “no objective database of neighborhood boundaries” for American cities. (Yeh, “CS183C Session 12: Nirav Tolia, Nextdoor”) ↩
- Jackson, Crabgrass Frontier. ↩
- Pariser, The Filter Bubble. ↩
- Masden et al., “A Multi-Neighborhood Study of Nextdoor.” ↩
- Harshaw, “Nextdoor Becoming a Home for Racial Profiling.” ↩
- Waddell, “The Police Officer ‘Nextdoor.’” ↩
- Lee, “Nextdoor Flap.” ↩
- Hwang, “The Social Construction of a Gentrifying Neighborhood.” ↩
- Schelling, “Dynamic Models of Segregation.” ↩
- Some academics and commentators have also used Schelling’s models to excuse or minimize the extent of racism in housing markets; see discussion in Harwood, “Palinopsia.” ↩
- Laurie and Naggi, “Role of ‘Vision’ in Neighborhood Racial Segregation;” David O’Sullivan, “Changing Neighborhoods—Neighborhoods Changing;” Victor Stoica and Andreas Flache “From Schelling to Schools.” ↩
- Levin, “Racial Profiling via Nextdoor.com.” ↩
- Madden, “Neighborhood as Spatial Project.” ↩
- Davis, City of Quartz. ↩
- Cited in Harper’s, “Readings: If Looks Could Kill.” ↩
- Levin, “Racial Profiling via Nextdoor.com;” Jennifer Medina, “Website Meant to Connect Neighbors Hears Complaints of Racial Profiling.” ↩
- Shahani, “Social Network Nextdoor Moves to Block Racial Profiling Online.” ↩
- Yeh, “CS183C Session 12: Nirav Tolia, Nextdoor.” ↩
- Clift, “If NextDoor Really Was Next Door.” ↩
- O’Donovan, “Nextdoor Goes Dutch.” ↩
- Witness the furor over realtors’ efforts to rename part of London’s famed Bloomsbury literary enclave as the New York-inflected “Midtown.” (Dangerfield, “Historic London Districts ‘Rebranded” Midtown”) ↩
- O’Donovan, “Nextdoor Goes Dutch.” ↩
- Rao, “Where Nextdoor is Moving Next.” ↩
- Ford and Graham, “Linked Data and Opaque Digital Geographies.” ↩
- Cranshaw et al., “The Livehoods Project.” ↩
- Lynch, The Image of the City. ↩
- See Star and Griesemer, “Boundary Objects,” and Harvey and Chrisman, “Boundary Objects and the Social Construction of GIS.” ↩
- Woodruff, “Crowdsourced Neighborhood Boundaries.” ↩
- Lynch, The Image of the City. ↩
- There have been efforts to operationalize Lynch’s typology of urban spatial form in GIS software, most notably Raj Singh’s project identifying Lynchian nodes in contemporary Boston using a moving window zonal algorithm that searches an 152-meter radius around each cell in a raster model and classifies potential nodes by the diversity of nearby land uses. (Singh, “Sketching the City”) ↩
- In the United States and United Kingdom, counties and other legal spatial units are mapped as polygons, technically “relations” in OSM terms, aggregate data structures containing polyline boundaries, labels, and subregions. ↩
- Lynch, The Image of the City. ↩
- Chisholm and Cohen, “The Neighborhood Project.” ↩
- See Rose-Redwood, “Indexing the Great Ledger of the Community.” ↩
- Massey, “A Global Sense of Place.” ↩
- Glass, “Social Aspects of Town Planning.” ↩
- Herbert Gans, whose 1962 study of the West End of Boston The Urban Villagers is considered a canonical work in the study of the ‘traditional’ working-class neighborhood, notes that the ‘concept of the West End as a single neighborhood was foreign to the West Enders themselves,’ who instead divided up their social worlds into microgeographies encompassing individual blocks, families, ethnic groups, or religious and political jurisdictions. (Gans, The Urban Villagers) ↩
- O’Neill, Weapons of Math Destruction. ↩