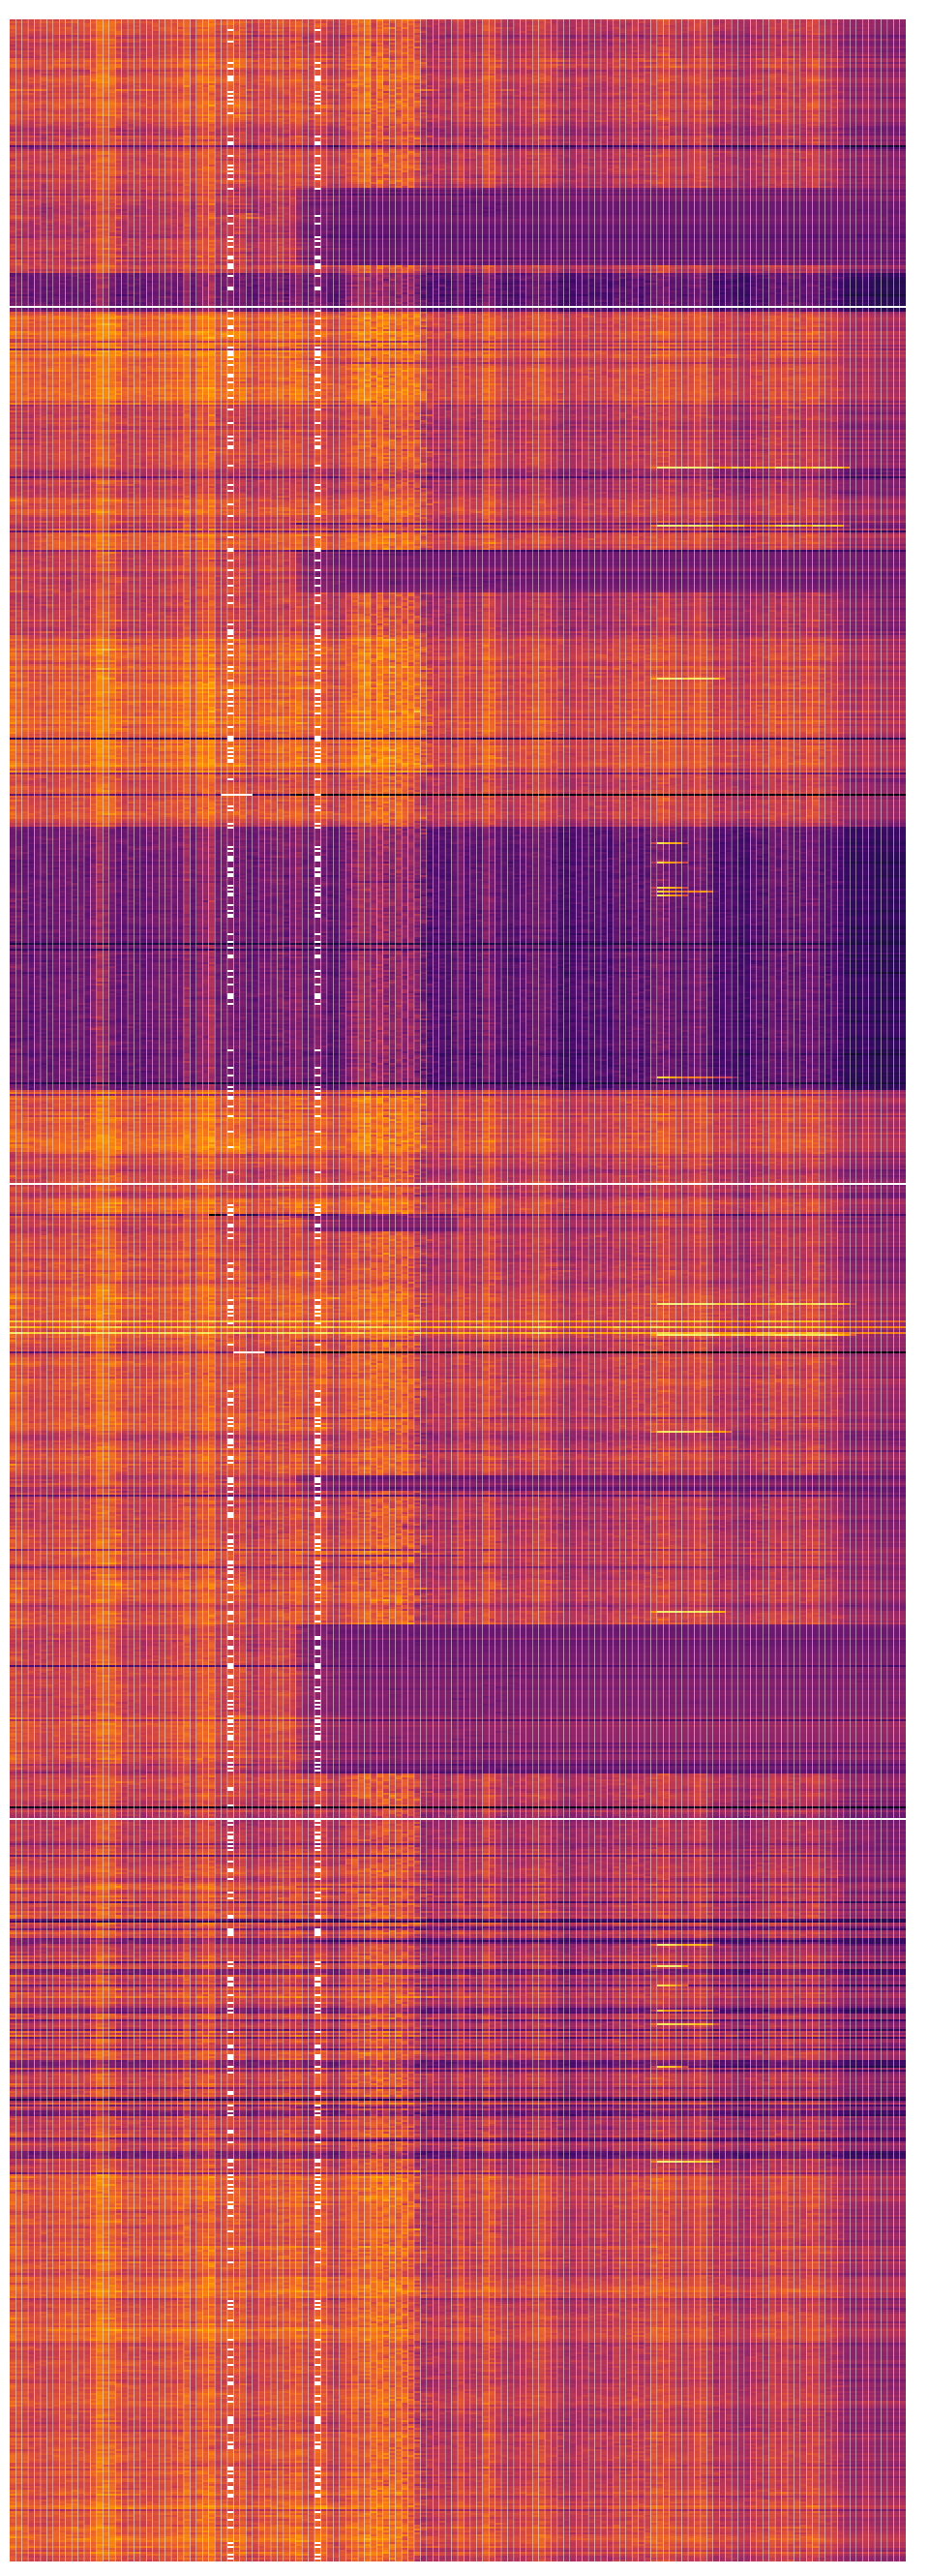
Figure 2. Heat-map visualization of memory usage over time, with one row per machine
Article Information
- Author(s):
- Affiliation(s):
- Publication Date:
- Issue:
- Citation: . “Figure 2. Heat-map visualization of memory usage over time, with one row per machine.” Computational Culture (). http://computationalculture.net/imperfect-orchestration-inside-the-data-centers-struggle-for-efficiency/figure2-7/.
Abstract